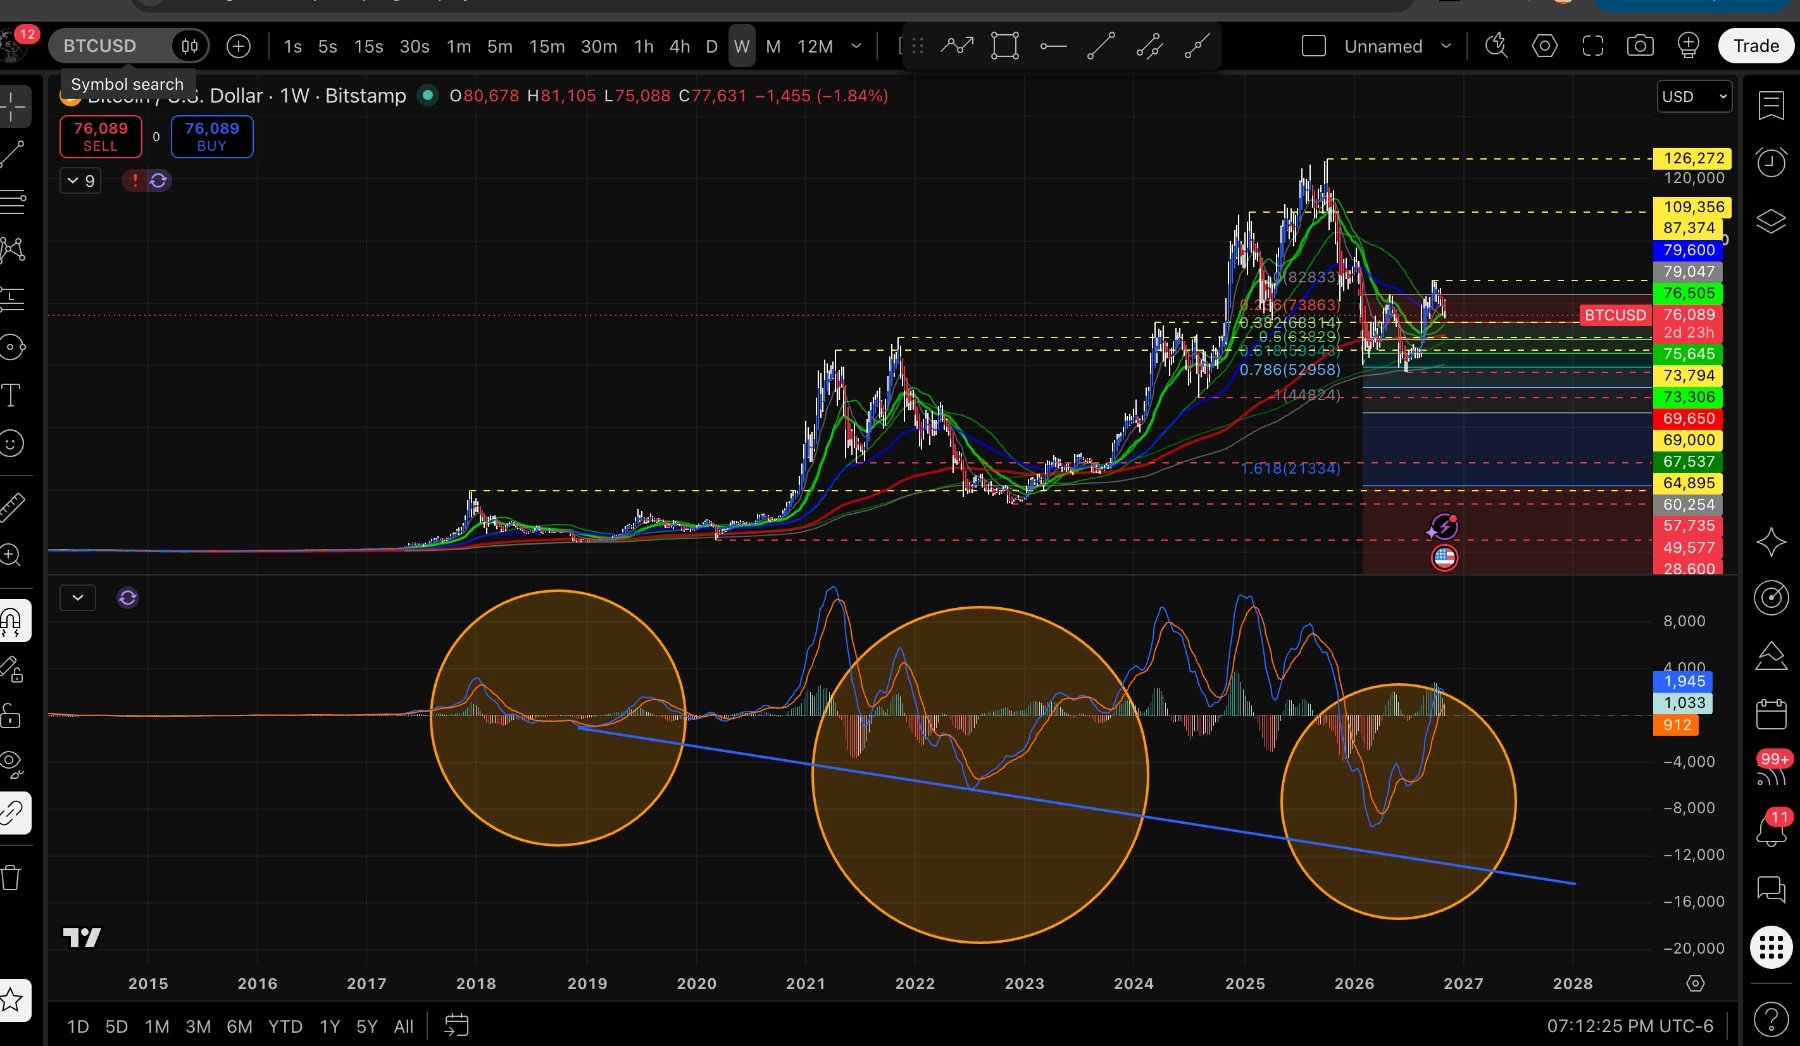
• Price structure: BTC put in that June low after the drop from the ~$126k ATH, recovered to the September high near $87k, and is now consolidating around $76k. That’s a classic higher-low / recovery structure off a major low rather than an ongoing collapse. • Weekly MACD: Both lines are now above zero (blue ~1,945, orange ~912) after the deep negative trough in the right circle. This matches the exact sequence that marked the end of the major corrective phases in the prior two circles on your chart (2018–19 and 2022–23). In those cases, once the lines cleared zero after the deep trough, the low was already in and the recovery leg was underway. • Multi-cycle parallel: The shape of the right-circle trough + the zero-line break is visually and structurally consistent with how the previous bottoms resolved.
 Open conversation